Using Wireshark
Wireshark is a GUI protocol analysis and packet capture tool that can view and
capture traffic much like tcpdump. Wireshark is Open Source software, freely
available at http://www.wireshark.org/. Wireshark can analyze capture files
generated by the pfSense® software GUI, tcpdump, Wireshark, or any other
software that writes files in the standard pcap file format.
Before proceeding, download and install Wireshark onto a client computer.
Viewing a Packet Capture File
To view a capture file in Wireshark, use one of the following methods:
- Manually Open File
The basic way to open a file manually is:
Start Wireshark
Navigate to File > Open
Locate the capture file and click it
Click the Open button
- Double Click
A file with a
.pcapextension can be opened by double clicking on it in Windows, macOS, and many Linux distributions. This action is typically performed in a file manager such as File Explorer, Finder, Nemo, Dolphin, or similar programs.- Download and Open
Browsers may often to open a downloaded capture file directly in Wireshark. This may be an option on a file download prompt, or an option from the list of downloaded files.
Once the file is open Wireshark displays a screen similar to Figure Wireshark Capture View which contains data from the capture file.
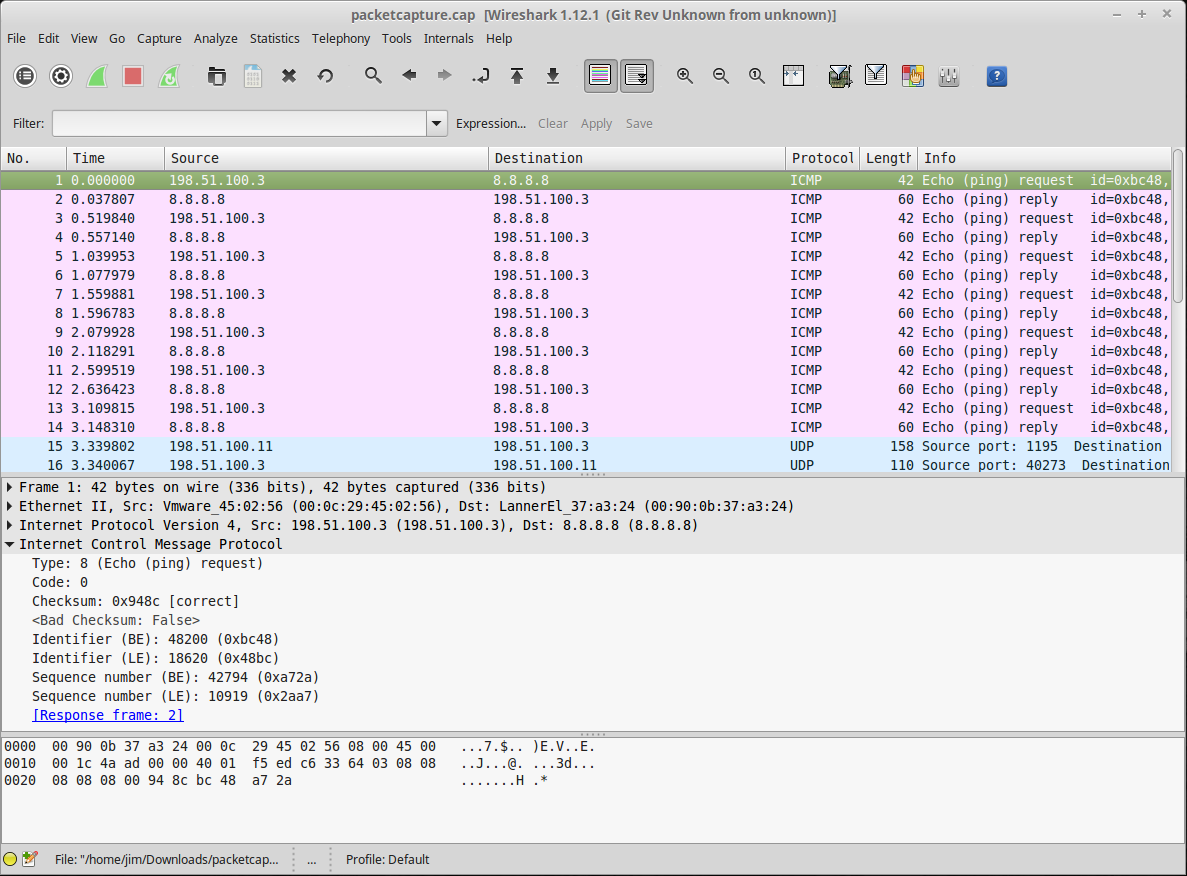
Wireshark Capture View
This view in Wireshark has a list summarizing the packets in the capture file in the top pane, with one packet per line. If there are too many packets, the results can be filtered using the Filter box on the toolbar.
Select a packet by clicking it in the list and the lower frames show the details of what is contained within the packet payload. The first lower pane shows a break-down of the packet structure, and each of these items can be expanded for more detail. If the packet is part of a protocol known to Wireshark, in some cases it can interpret the data and show even more details. The bottom pane shows a hexadecimal and ASCII representation of the data contained in the packet.
Viewing the capture this way makes it easy to see the flow of traffic with as much or as little detail as needed.
Wireshark Analysis Tools
While some problems will require considerable knowledge of how the underlying protocols function, the analysis tools built into Wireshark helps lessen that need for many protocols. The Analyze and Statistics menus have a few options that automate some of the analysis and provide summarized views of capture content. The Expert Info options under the Analyze menu show a list of errors, warnings, notes and network conversations contained in the capture.
Wireshark may note errors for incorrect checksums. This is because most network interfaces handle checksums in hardware directly before putting it on the wire. This is the only exception to the earlier note saying what is shown in a packet capture is what is on the wire. Traffic sent from the system where the capture is taken will have incorrect checksums where they are performed in hardware, though traffic coming in from a remote system should always have correct checksums. Checksum offloading can be turned off to ensure traffic is shown exactly as the host is putting it on the wire, though usually this is safe to ignore. To verify checksums, capture traffic from another system using a network tap or switch span port.
Tip
Span ports can also be setup on bridges in pfSense software, see Span Port for more information.
The Telephony menu is one example of automated analysis Wireshark can perform. These functions make it easy to diagnose VoIP problems. In the example shown in Figure Wireshark RTP Analysis, VoIP traffic was traversing an MPLS WAN circuit with the provider’s routers attached to an OPT interface of pfSense software on both sides. A capture from the OPT interface on the initiating end showed no loss, indicating the traffic was being sent to the provider router, but the OPT interface on the opposite end showed considerable packet loss in one direction when multiple simultaneous calls were active. These packet captures helped convince the provider of a problem on their network, and they found and fixed a QoS configuration problem on their side.
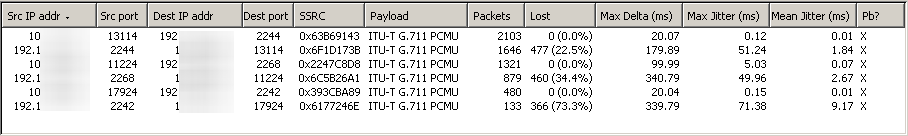
Wireshark RTP Analysis
When viewing a packet capture containing RTP traffic, click Telephony > RTP > Show all streams to see this screen.
Remote Real-time Capture
From a UNIX host that has Wireshark available, real-time remote capture is possible by redirecting the output from an SSH session. This has been tested and known to work on FreeBSD and Ubuntu-based Linux distributions.
In order to use this technique, SSH must be enabled on pfSense software and an
SSH key is required (see Secure Shell (SSH)). The key must first be loaded into
ssh-agent or generated without a passphrase because the redirection will not
allow the user to enter a password or passphrase.
Warning
Using ssh-agent is the best practice as any key without a passphrase is
highly insecure.
Before attempting this technique, check that the user can connect to the
firewall running pfSense software using an SSH key without needing to type the
passphrase. The first time the user connects, they are prompted to save the host
key, so that must also be done before trying to start Wireshark. ssh-agent
may also be started from a terminal window or shell like so:
# eval ssh-agent
Agent pid 29047
# ssh-add
Enter passphrase for /home/jimp/.ssh/id_rsa:
Identity added: /home/jimp/.ssh/id_rsa (/home/jimp/.ssh/id_rsa)
Then start an SSH session as usual:
# ssh root@192.168.1.1
The authenticity of host '192.168.1.1 (192.168.1.1)' can't be established.
DSA key fingerprint is 9e:c0:b0:5a:b9:9b:f4:ec:7f:1d:8a:2d:4a:49:01:1b.
Are you sure you want to continue connecting (yes/no)? yes
Warning: Permanently added '192.168.1.1' (DSA) to the list of known hosts.

*** Welcome to pfSense ***
[...]
After confirming the SSH connection works, start the remote capture as follows:
# wireshark -k -i <(ssh root@192.168.1.1 tcpdump -i igb1 -U -w - not tcp port 22)
Replace 192.168.1.1 with the IP address of the firewall running pfSense
software. The not tcp port 22 filter excludes traffic from the SSH session,
which will otherwise clog the capture output. The above is written in BASH style
syntax, but may work with other shells. Adjust the tcpdump arguments for the
interface, and add additional expressions. The -U and -w - are necessary
so that it writes the output to stdout, and writes each packet as it
arrives.
See also
The Capture Setup/Pipes page on the Wireshark wiki contains other related techniques.